> For the complete documentation index, see [llms.txt](https://docs.relevant-digital.com/llms.txt). Markdown versions of documentation pages are available by appending `.md` to page URLs; this page is available as [Markdown](https://docs.relevant-digital.com/ad-revenue-insights/alarms-and-notifications/setting-up-your-ad-revenue-insights-alarms.md).
# Setting Up Your Ad Revenue Insights Alarms
Create custom Ad Revenue Insights alarms, choose the right metrics to monitor, and understand when to use ARI or HB Analytics alerts.
The Ad Revenue Insights module includes a powerful alarms feature, accessible via the Alarms menu. It enables you to track nearly any metric from your reports and create fully customised alerts tailored to your daily workflow.
The alarms in the Ad Revenue Insights module can be accessed through the Alarms menu item and can be used to track virtually any metric available from the reports. It is a powerful tool that allows you to build alarms in a completely customised way, based on what your day-to-day work focuses on.
### When Should I Use Ad Revenue Insights Alarms and When Should I Use HB Analytics Alarms?
The choice depends on what you want to monitor, as some metrics are specific to the different reporting types. It also depends, in cases of overlap, on how quickly you need the trigger to occur, and whether you are using both modules or only the Ad Revenue Insights module.
Data in Ad Revenue Insights is imported on a daily basis, because some information is not yet complete or consolidated enough for proper analysis. Any alarms built on the API data will therefore have a one-day delay. This is not critical when monitoring general levels and provides stable data over time, allowing for longer-term alarm options. For more technical alarms, however, HB Analytics alarms are preferred, as they trigger within the hour.
### How Do I Set Up an Ad Revenue Insights Alarm?
Start by clicking the Alarms menu item, then open the Alarms drop-down to view active alarms:
Here you can view and manage existing alarms. To set up a new alarm, click the New Ad Revenue Insights Alarm -button. You now have the option to create a Custom alarm or select one of the presets. In this guide, we will focus on the custom alarm, as it offers the most options.
This will bring you to a screen that resembles the normal reporting screen. Setting up an alarm is very similar to pulling a report, but there are a few unique considerations:
{% stepper %}
{% step %}
## Name your alarm
Give your alarm a name. If you share the alarm, this will also be the name other users see.
{% endstep %}
{% step %}
## Set the dates
Dates work differently for alarms, so it is usually best to select a dynamic time period in the date range, such as "Per Month". The alarm will then trigger based on events that take a full month into consideration (or several months if you are working with trend metrics).
{% endstep %}
{% step %}
## Select what to report on
If you want to measure, for example, "Revenue levels on websites" and use real values, you will likely need multiple alarms, one per website, if trigger levels differ per site. Apply a filter for the website you want to use. If you prefer to use percentages, trend metrics should be used.
{% endstep %}
{% step %}
## Choose metrics
Both normal and trend metrics can be used. For normal metrics, real values must be entered, whereas for trend metrics percentages can be used. Once selected, press OK.
{% endstep %}
{% step %}
## Set the alarm condition
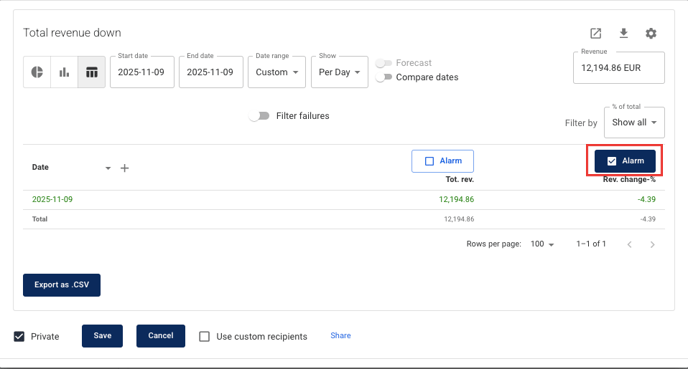
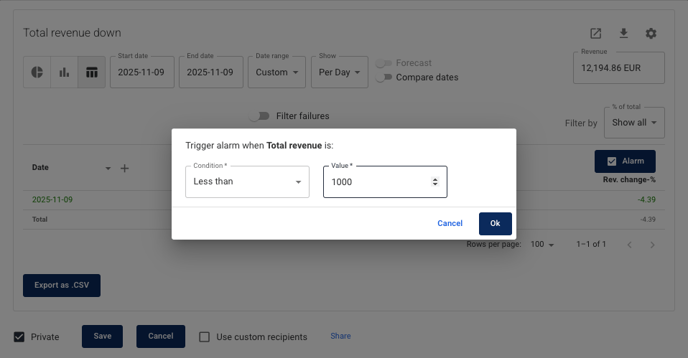
You will now see a report created based on your settings and the available values. On the right side of the configuration screen, click the Alarm button. You will be prompted to set a condition for your alarm trigger. For example, choose "Less than" and then select a value, such as 1000 Euro. Press OK.
{% endstep %}
{% step %}
## Share your alarm
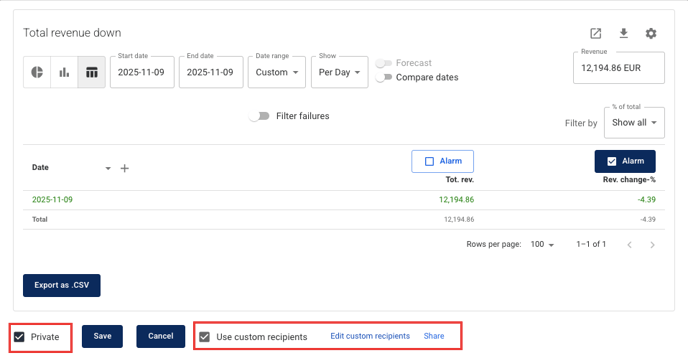
You can choose whether the alarm should be private or visible to others in your organisation. By default, the alarm is set to private and is visible only to you. To make it available to all, untick the Private box.
You can also share the alarm by subscribing users to it. Click Use custom recipients, and the selected users will receive an email when the alarm is triggered. To send the alarm to an external user, click Edit custom recipients. To send alarm notifications to a Yield user, click Share and select the users from the list.
#### Slack notifications
Email notifications remain available for alarm recipients. When the [Using the Relevant Yield Slack Integration](/general-platform/using-the-relevant-yield-slack-integration.md) is enabled, alarms can also send notifications to Slack. When editing alarm recipients, connect your Slack workspace and select Slack recipients. See [Using the Relevant Yield Slack Integration](/general-platform/using-the-relevant-yield-slack-integration.md) for setup details.
{% endstep %}
{% step %}
## Save your alarm
You can now save your alarm. Press Save once you are satisfied with your alarm settings. You can edit the alarm later if needed.
{% endstep %}
{% endstepper %}
### Checking Your Triggered Alarms
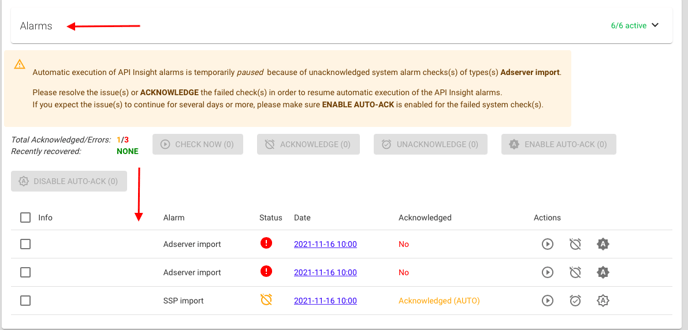
In the top-panel Alarms (collapsed by default), you will see the alarms that have been created, while the lower (main) part shows the individual failures or recoveries of the alarms. These are called checks. One alarm can trigger multiple checks to fail, for example, if two websites have revenues that are too low.
If there are multiple conditions, AND logic will be used between them. This allows you, for example, to set up a "low-CPM" alarm that triggers only when the number of ad requests is above a certain threshold. OR conditions are not supported, as it is generally more intuitive to create separate alarms instead. For example, create one Low Revenue alarm and one High Timeout % alarm, rather than a single "Low Revenue or High Timeout %" alarm.
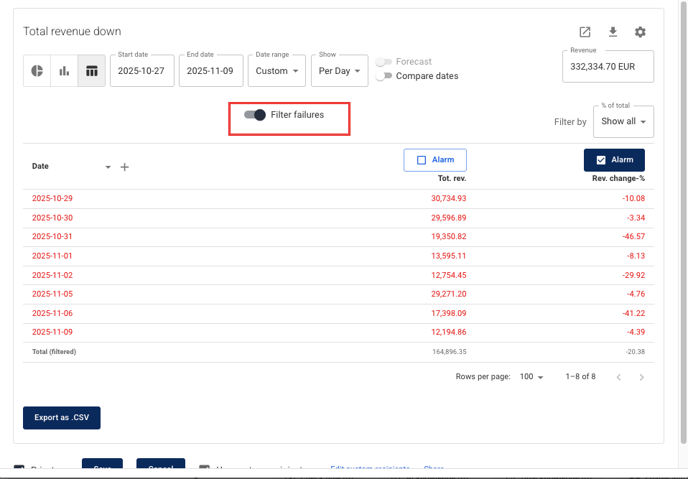
The **Filter failures** switch is useful for displaying only the failed (red) lines in the report.
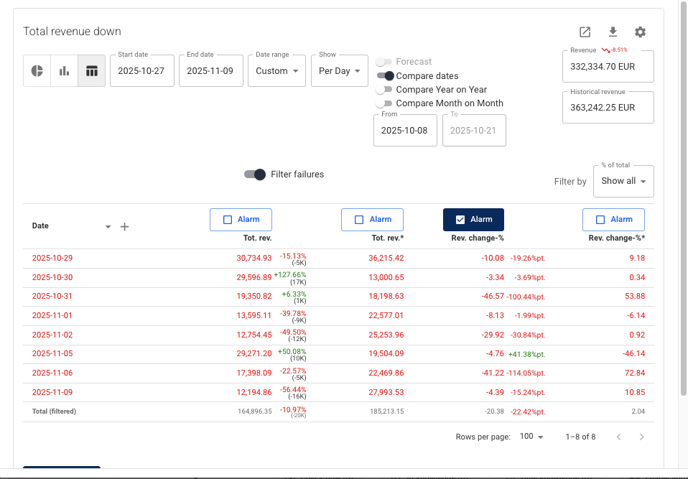
For compare-to metrics, the logic is slightly different, as shown below:
There are a few differences between alarm reports and normal reports:
* Forecasting cannot be selected.
* All dates, including Start, End, and Compare to, are automatically converted to relative dates when saving, as we do not want alarms checking the same time ranges repeatedly.
{% hint style="warning" %}
By default, alarm reports will not run if there is an unacknowledged import error, because there is a high likelihood that many alarms would trigger as a result of the failed imports.
{% endhint %}
### Description of Alarm Panel
| Field | Description |
| ----------------------- | ------------------------------------------------------------------------------------------------------------------------------------------------------------------------------------------ |
| **Active** | An active alarm runs automatically, either after imports for programmatic alarms or on a time schedule for HBA alarms. You can still run inactive alarms manually from this page. |
| **Owner** | Shows whether the alarm is only visible to you or global. |
| **Sharing** | Shows whether the alarm is shared with others through email notifications. |
| **Acknowledged/Errors** | Shows how many checks have been acknowledged and the total number of checks generated by the alarm. |
| **Check run** | When alarms are run manually, this column updates with `OK` check marks or error symbols if there was an error running the alarm. This is not the same as failures generated by the alarm. |
| **Actions** | Corresponds to the action buttons at the top of the list, used for bulk actions. It also contains the **Edit** button. |
| Action | Description |
| --------------------------------------------------------------------------------------------------------------------------------------------------------------------------- | ------------------------------------------------- |
|  **Check now** | Run the alarm now. |
|  **Edit** | Edit the alarm settings. |
|  **Deactivate** | Deactivate the alarm when it is no longer needed. |
|  **Disable** | Disable the alarm from being triggered again. |
|  **Enable re-trigger** | Enable the alarm to be triggered again. |
### Description of Checks Panel
| Field | Description |
| ---------------- | -------------------------------------------------------------------------------------------------------------------------------------------------------------------------------------------------------------------------------------------------------------------------------------- |
| **Info** | Description of the failed object. For example, `blog-portal.com - Top banner 980x180` means a report alarm was created with the dimensions site and placement, and that report line failed the alarm condition. |
| **Alarm** | Name of the alarm. |
| **Status** | Shows whether the alarm is failed and not acknowledged (red balloon), failed and acknowledged (orange), or recovered (green). |
| **Check run** | Same as **Check run** for alarms. |
| **Date** | Date of the last check. Clicking the link opens a popup with the recent history of the check. This includes times when the status changed between failed and recovered, along with the latest check. |
| **Acknowledged** | Shows whether the alarm has been acknowledged by you or someone on your team for shared alarms. |
| **Actions** | Corresponds to the action buttons at the top of the list, used for bulk actions. It also contains the **View report** buttons, which display a report with the same settings used when performing the check. The report itself is not saved, so the state may differ when you open it. |
| Action | Description |
| -------------------------------------------------------------------------------------------------------------------------------------------------------------------------- | ------------------------------------------------------------------------------------------------------------------------------------------------------------------------------------------------------------------ |
|  **Check now** | Run the alarm now. |
|  **View report** | View the alarm report that was triggered to show the data. |
|  **Acknowledge** | Mark that the alarm has been checked. This removes the alarm notification from the left menu. |
|  **Enable auto-ack** | Acknowledge this triggered line automatically. This is useful when you know something will always trigger under the alarm’s conditions, such as a seasonal placement that only has revenue during certain periods. |
|  **Disable auto-ack** | Show the notification for this line again in the triggered alarms. |
### Other Settings
| Setting | Description |
| --------------------------------------------------- | --------------------------------------------------------------------------- |
| **Generic settings → Edit global alarm recipients** | Enter the email address or addresses for global, non-private alarms. |
| **Generic settings → Edit my alarm recipients** | Enter the email address or addresses for the current user’s private alarms. |
| **Show checks → Unacknowledged** | Display unacknowledged errors. |
| **Show checks → Acknowledged** | Display acknowledged checks. |
| **Show checks → Recently recovered** | Display checks that have recovered within the last seven days. |
---
# Agent Instructions
This documentation is published with GitBook. GitBook is the documentation platform designed so that both humans and AI agents can read, navigate, and reason over technical content effectively. Learn more at gitbook.com.
## Querying This Documentation
If you need additional information that is not directly available in this page, you can query the documentation dynamically by asking a question.
Perform an HTTP GET request on the current page URL with the `ask` query parameter, and the optional `goal` query parameter:
```
GET https://docs.relevant-digital.com/ad-revenue-insights/alarms-and-notifications/setting-up-your-ad-revenue-insights-alarms.md?ask=&goal=
```
`ask` is the immediate question: it should be specific, self-contained, and written in natural language.
`goal` is optional and describes the broader end goal you are ultimately trying to accomplish on behalf of the user. GitBook uses it to tailor the answer towards what is most useful for that goal.
The response will contain a direct answer to the question and relevant excerpts and sources from the documentation.
Use this mechanism when the answer is not explicitly present in the current page, you need clarification or additional context, or you want to retrieve related documentation sections.