> For the complete documentation index, see [llms.txt](https://docs.relevant-digital.com/llms.txt). Markdown versions of documentation pages are available by appending `.md` to page URLs; this page is available as [Markdown](https://docs.relevant-digital.com/ad-revenue-insights/dashboards-and-reporting/ad-revenue-insights-dimensions-and-metrics.md).
# Ad Revenue Insights - Dimensions and Metrics
Learn how to configure Ad Revenue Insights reports with dimensions, metrics, filters, trend metrics, and reporting limitations.
The Ad Revenue Insights module, which is used for dashboards, reports, and alarms, contains various settings that are listed below.
First, navigate to the Reports section and choose 'New Report' or select an existing report and go to Edit.
| Setting | Description |
| ---------------------------- | ---------------------------------------------------------------------------------------------------------------------------------------------------------------------------------------------- |
| **Title** | What is the name of the report or dashboard? |
| **Filter by My Advertisers** | If you are a Sales Rep user or an Admin user with a dedicated advertiser portfolio, select this option to filter by your specific Advertiser or Buyer portfolio. |
| **Forecast** | If selected, you need to choose a date that ends in the future. The system then forecasts based on the performance of the last three weeks and displays the average of that period. |
| **Date Range** | Select the dates for your report. Dates can be dynamic, such as the last 30 days, fixed, with a specific start and end date, or based on a named range, such as “This quarter” or “Last year”. |
| **Show** | Select a date breakdown, such as “Per Day” or “Per Month.” |
| **Compare Date Range** | Compare two sets of dates with the same length. |
### **Dimensions**
The dimensions are at the core of what you want to report on. By adding multiple dimensions using the "+", you can organise the order in which they are listed and move them up and down using the arrows. If you want to remove a dimension, simply click the trash can icon.
The Dimensions you can use are:
| Dimension | Description |
| ------------------- | ------------------------------------------------------------------------------------------------------------------------------------------------------------------------------------------------------------------------- |
| **Date** | Shows the dates you have selected as a dimension. |
| **Publisher** | The Publisher accounts you have added in your setup. |
| **Site** | The websites you have added in your setup. |
| **Placement** | The placements added in your setup. |
| **Source** | The SSP placement source collected from the SSPs. |
| **SSP** | The SSPs added to your setup. |
| **Revenue Type** | Breakdown between “Direct campaigns”, “Deals”, and “OpenRTB”. |
| **Advertiser** | Advertisers from the SSPs and your ad server. |
| **Buyer** | The Buyer or SeatID from your added SSPs. |
| **Sales Rep** | Your company’s sales representatives added to your setup. |
| **Deal** | The deals in your systems. If you want extra data on your deals, the Deal ID and Deal Name are available as attributes below the metrics. |
| **Placement Label** | The label you have given to the placements in your account. If you do not have this dimension, you have not yet assigned a label to any placements. |
| **Deal Type** | Breaks down your deals based on the type of deal through which you generate revenue. |
| **DSP** | Breaks down your metrics by the DSP used through the SSPs. |
| **Payment Type** | Breaks down your metrics based on the payment type used to create revenue, such as impressions or clicks. |
| **Media Type** | Breaks down your metrics based on the media type being used, such as Display, Native, or Video. |
| **Creative Size** | The creative dimensions that have generated revenue in your system. |
| **Order** | Imported from Xandr, Ad Manager, and Adform. If you want extra data on your orders, the Order ID and Order Name are available as attributes below the metrics. This dimension only reports on Direct revenue. |
| **Line Item** | Imported from Xandr, Ad Manager, and Adform. If you want extra data on your line items, the Line Item ID and Line Item Name are available as attributes below the metrics. This dimension only reports on Direct revenue. |
### **Metrics**
| Metric | Description |
| --------------------------------- | -------------------------------------------------------------------------------------------------------------------------------------------------------------------------------------------------------------------------------------------------------- |
| **Total Revenue** | Revenue after the SSP and ad server revenue share. Some SSPs and ad servers deliver gross revenue, while others deliver net revenue. |
| **API Gross Revenue** | The raw revenue values collected from the SSPs and ad servers, without any cuts subtracted. |
| **Network Revenue** | If you have a revenue share on the publisher accounts, this is the network's revenue. |
| **Publisher Revenue** | If you have a revenue share on the publisher accounts, this is the publisher's revenue. |
| **Ad Server In** | The number of impressions coming into your ad server placement or header bidder call. This value is used to calculate ad server eCPM (RPM) and fill rate percentage. |
| **Estimated SSP In** | The impression traffic going into a particular SSP. Not all SSPs deliver this value. |
| **Sold Impressions** | The impressions sold in either the ad server or the SSPs. This metric is used to calculate fill rate percentage. |
| **Page Views** | The number of page views collected from your analytics system. This metric is not compatible with all dimensions, including placements. |
| **Sessions** | The number of user sessions collected from your analytics system. |
| **Avg. Session Duration** | The average duration of user sessions collected from your analytics system. |
| **Total eCPM** | The eCPM value calculated as Total Revenue divided by Sold Impressions. |
| **Publisher eCPM** | The eCPM value calculated as Publisher Revenue divided by Sold Impressions. |
| **Ad Server eCPM** | The eCPM value calculated as Total Revenue divided by Ad Server In. |
| **Page Views eCPM** | The eCPM value calculated as Total Revenue divided by Page Views. |
| **Session eCPM** | The eCPM value calculated as Total Revenue divided by Sessions. |
| **Fill Rate Percentage** | The percentage calculated between Sold Impressions and Ad Server In. |
| **Unfilled Inv.** | The actual amount of unfilled inventory, calculated from Ad Server In and Sold Impressions. |
| **Estimated SSP Fill Percentage** | The percentage calculated between Sold Impressions and Estimated SSP In. |
| **Network Revenue Percentage** | The percentage share of Network Revenue versus Publisher Revenue. |
| **Clicks** | The number of times users click an ad after viewing it. |
| **Click-Through Rate Percentage** | The percentage of ad impressions that resulted in clicks, calculated as `CTR(%) = (Clicks / Ad Impressions) * 100`. |
| **Viewability Percentage** | The percentage of an ad viewed on the user's screen. Based on IAB standards, an ad counts as viewed when 50% of its pixels are visible for at least one second. It is calculated as `viewable impressions / viewable measured = viewability percentage`. |
| **Viewable Impressions** | The number of ad impressions that meet the viewability criteria. |
| **Viewable Measured** | The number of ad impressions that were successfully measured for viewability. |
#### **Trend Metrics**
Trend Metrics are similar to the normal metrics but focus on the changes across the periods that are selectable below the metrics.
{% columns %}
{% column %}
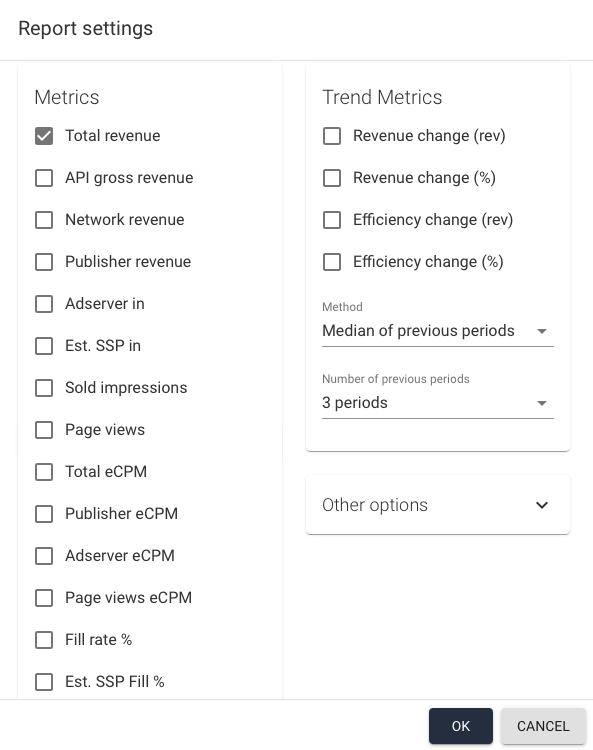
Configure Revenue Change in the report settings. Choose the comparison method and the number of previous periods.
* **Method:** Calculate the baseline using the **average** or **median** of previous periods.
* **Previous periods:** Select between **1** and **5** previous periods.
Each previous period matches the length and days of the selected date range. For example, a Monday–Tuesday range compared with one previous period uses the previous week’s Monday–Tuesday range. The Revenue Change then uses either the average or median baseline you selected.
{% endcolumn %}
{% column %}
{% endcolumn %}
{% endcolumns %}
| Trend Metric | Description |
| --------------------------- | ------------------------------------------------------------------------------------------------------------------------------------------------------------------------------------------------------------------------------------------------------------------------------------------------------------------------------------------------------------------------------------------------------ |
| **Revenue Change (Rev)** | The revenue change in real numbers. |
| **Revenue Change (%)** | The revenue change in percentages. |
| **Efficiency Change (%)** | Ad server eCPM change in percentages. |
| **Efficiency Change (Rev)** | Change in revenue compared to a scenario where ad server eCPM had remained identical to the compared period. For example, if you earned $10 from 10,000 ad requests last week, with an ad server eCPM of 1.0, and $20 from 25,000 ad requests this week, with an ad server eCPM of 0.8, the Efficiency Change (Rev) is -$5.0. That means you lost $5.00 by not maintaining last week's ad server eCPM. |
### **Other Options**
These options are generally not used very often, but they can be very useful in certain cases.
| Option | Description |
| ----------------------- | ------------------------------------------------------------------------------------------------------------------------------------------------------------------------------------------------------------------------------------ |
| **Currency** | Select a different currency output than your default currency. |
| **Advertiser Mapping** | Select an alternative advertiser mapping instead of your default one. For more details, see [Mapping Advertisers, Buyers and DSPs for Reporting](/ad-revenue-insights/mapping/mapping-advertisers-buyers-and-dsps-for-reporting.md). |
| **Max Advertisers** | Specify how many advertisers should be loaded in the report or dashboard. |
| **Revenue Corrections** | Select whether to apply the revenue corrections added to this report or dashboard. |
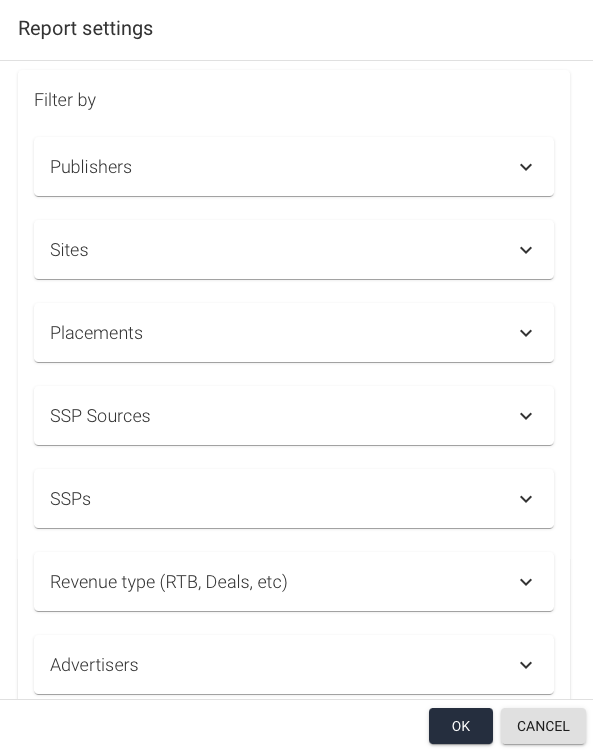
### **Filter By**
All your dimensions are also filterable, which means you can limit the scope to one or several dimensions you want to report on. This can be very useful for narrowing down the dataset to only show the critical data you wish to examine, making the report more precise.
### **Reporting Limitations**
Don’t be afraid to try different combinations; nothing will ever break. However, if your report becomes extremely large, it may time out. In that case, simply try again with a slightly smaller dataset.
{% hint style="warning" %}
Advertiser, line item, order, buyer, and deal filters only return 60 days of historical data.
{% endhint %}
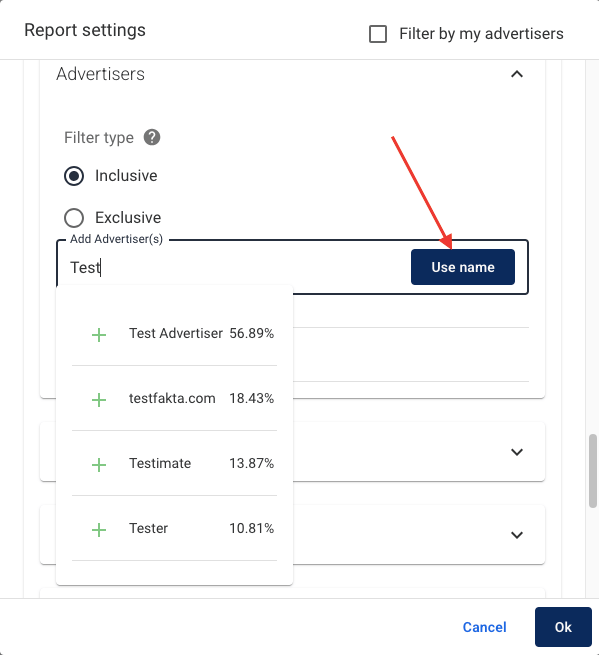
For example, if you are building a report that uses filters to include or exclude advertisers, the suggestions will only show advertisers that have had revenue in the last 60 days. To filter by an advertiser that has not recorded revenue during this period, you can enter its exact name and click Use name. If the advertiser exists, you will be able to add it as a filter.
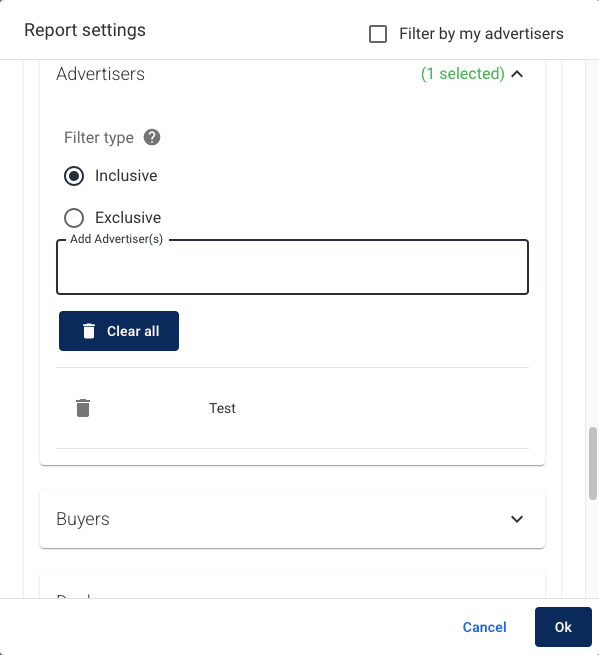
In the screenshot below, you can see the view when an advertiser has been successfully added as a filter.
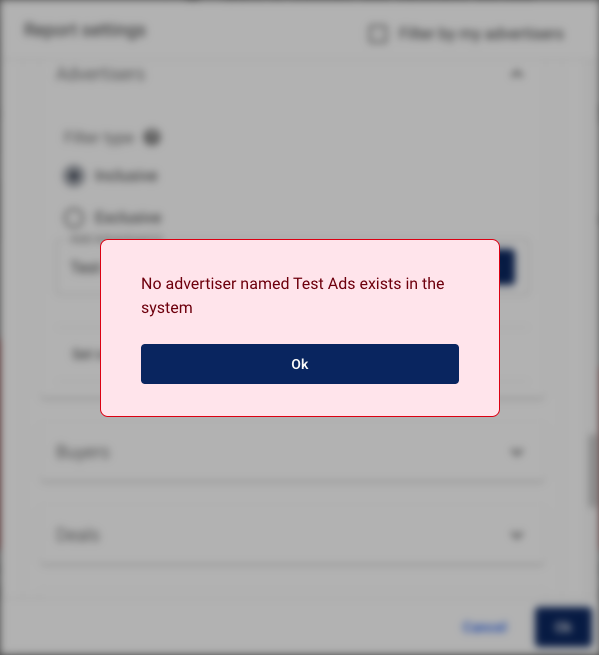
If it does not exist at all, Yield will display the following error:
The same applies to buyers, advertisers, orders, line items, and deals. You can still filter by them, but you must use the exact name as it appears in your ad server or SSP.
---
# Agent Instructions
This documentation is published with GitBook. GitBook is the documentation platform designed so that both humans and AI agents can read, navigate, and reason over technical content effectively. Learn more at gitbook.com.
## Querying This Documentation
If you need additional information that is not directly available in this page, you can query the documentation dynamically by asking a question.
Perform an HTTP GET request on the current page URL with the `ask` query parameter, and the optional `goal` query parameter:
```
GET https://docs.relevant-digital.com/ad-revenue-insights/dashboards-and-reporting/ad-revenue-insights-dimensions-and-metrics.md?ask=&goal=
```
`ask` is the immediate question: it should be specific, self-contained, and written in natural language.
`goal` is optional and describes the broader end goal you are ultimately trying to accomplish on behalf of the user. GitBook uses it to tailor the answer towards what is most useful for that goal.
The response will contain a direct answer to the question and relevant excerpts and sources from the documentation.
Use this mechanism when the answer is not explicitly present in the current page, you need clarification or additional context, or you want to retrieve related documentation sections.