> For the complete documentation index, see [llms.txt](https://docs.relevant-digital.com/llms.txt). Markdown versions of documentation pages are available by appending `.md` to page URLs; this page is available as [Markdown](https://docs.relevant-digital.com/hb-analytics/alarms-and-notifications/setting-up-your-hb-analytic-alarms.md).
# Setting up your HB Analytic Alarms
How to create and manage alarms in HB Analytics to monitor metrics and get notified when thresholds are breached.
## Setting Up HB Analytics Alarm
HB Analytics alarms let you monitor any metric in real time and get notified when something goes wrong — a bidder dropping off, revenue falling below a threshold, timeouts spiking, and so on. Alarms trigger within the hour, making them the right tool for catching technical issues fast.
> :lightbulb: **HB Analytics alarms vs. Ad Revenue Insights alarms** Use HB Analytics alarms when you need fast, within-the-hour alerts on technical metrics. Ad Revenue Insights alarms run on daily imported data — better suited for longer-term revenue monitoring, but not for catching issues in real time.
{% stepper %}
{% step %}
### Creating a New Alarm
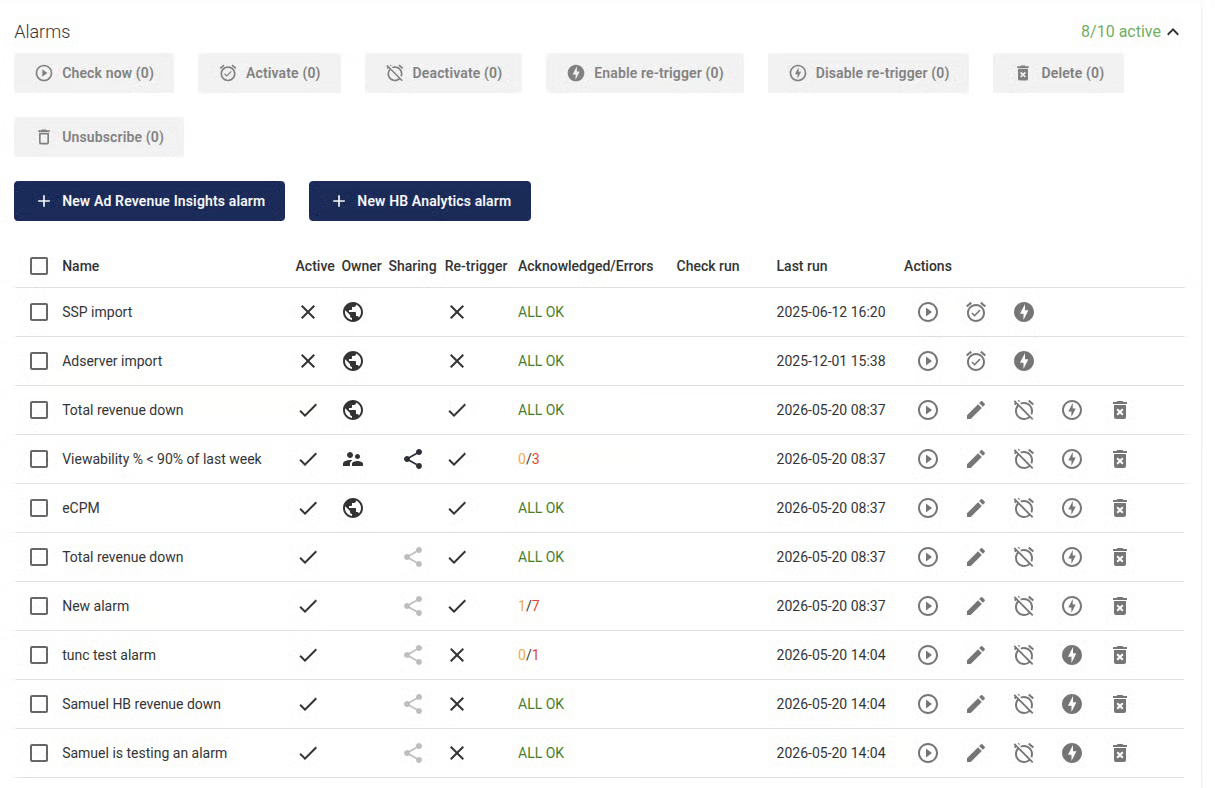
Go to Alarms in the top menu and expand the Alarms dropdown to see your active alarms.
Here you can see and manage the existing alarms.
{% endstep %}
{% step %}
### Add new alarm
**Click + New HB Analytics Alarm** Choose **Custom alarm** to get full control. Presets are available for common use cases.
{% endstep %}
{% step %}
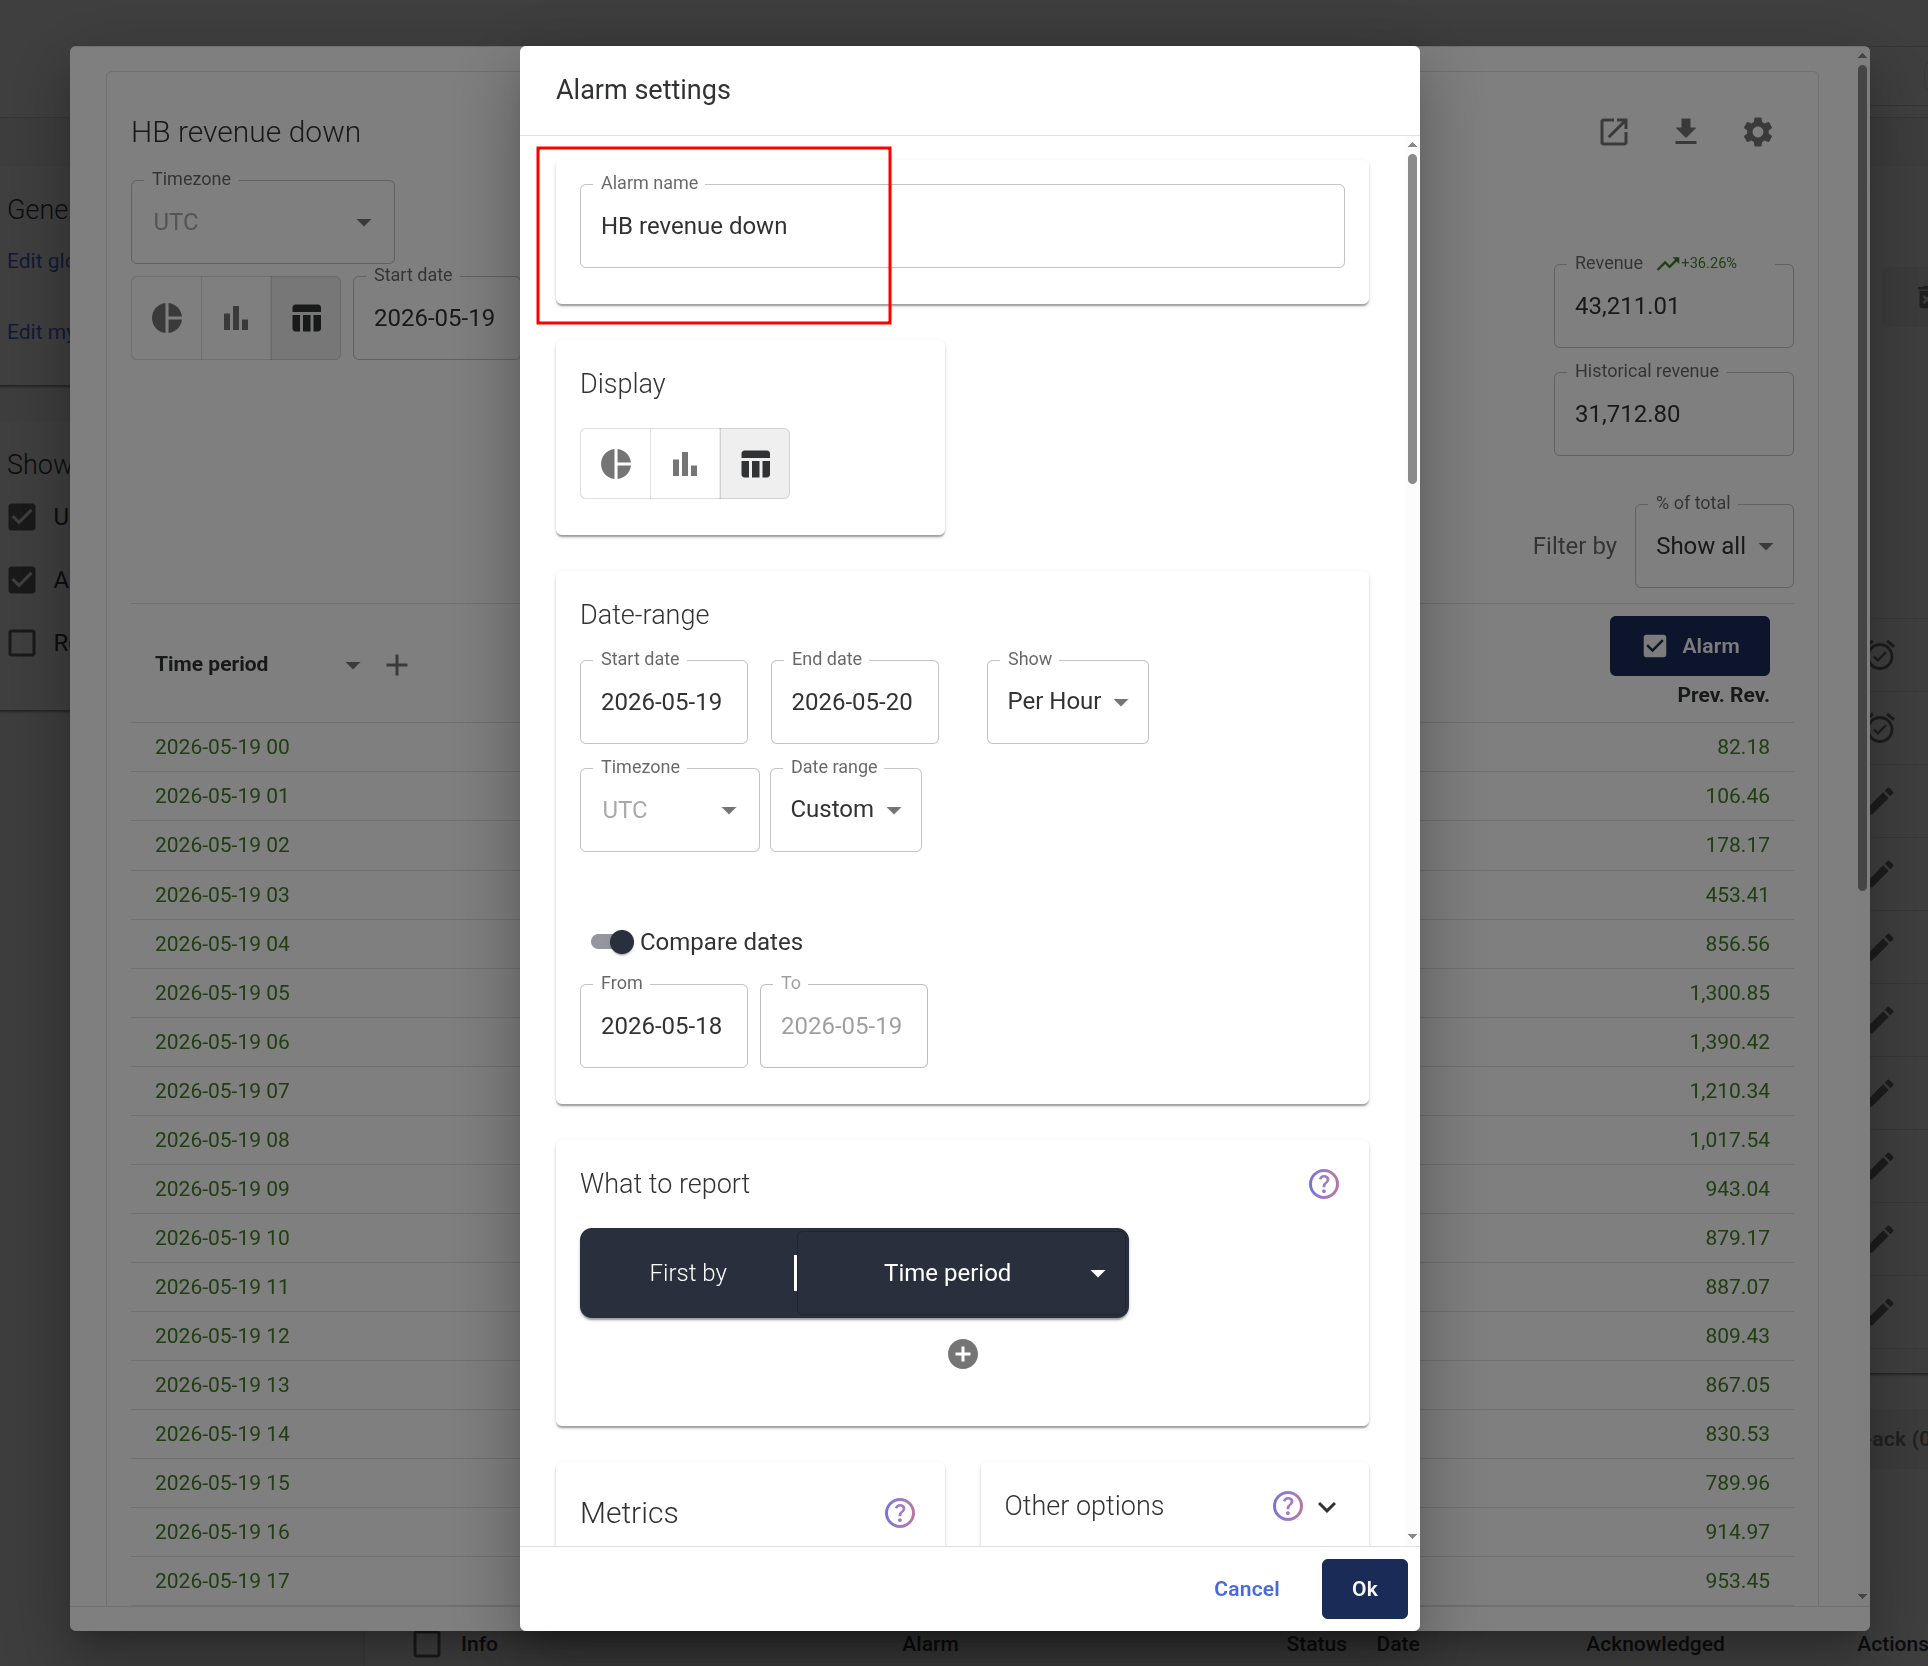
### Name your Alarm
Give it a clear name — this is what other users will see if you share it.
{% endstep %}
{% step %}
### Set the date range
Alarms use dynamic time periods, not fixed dates. Choose a period like **Per Day** so the alarm evaluates a full day of data each time it runs.\

{% hint style="info" %}
**Good to know:** HB Analytics uses real-time data. Shorter time periods catch problems faster.
{% endhint %}
{% endstep %}
{% step %}
#### Choose what to monitor
Select the `dimensions and metrics` you want to track. A few things to keep in mind:
* If you want to monitor a metric **per bidder** with different thresholds per bidder, create **one alarm per bidder** rather than one alarm covering all.
* Use **filters** to narrow down to the specific bidders, sites, or placements you care about.
{% endstep %}
{% step %}
### Set up your trigger condition
There are two types of triggers — choose the one that fits your use case:
| Trigger type | When to use | Alarm button |
| -------------- | -------------------------------------------------------------------------------------------------------------- | ------------------------------------------------ |
| Absolute value | You have a fixed threshold (e.g. revenue drops below €1,000) | Left ALARM button |
| % change | Levels vary a lot between dimensions and a relative drop makes more sense (e.g. a bidder drops 30% day-on-day) | Right ALARM button (requires Compare date range) |
To use % triggers, enable **`Compare date range`** first, then use the right-hand ALARM button.
Once you press an ALARM button, set your condition (e.g. *Less than* → *10%*) and click **OK**.
> **Multiple conditions use AND logic.** For example: trigger only when CPM is low AND ad requests are above a threshold. OR logic isn't supported — create separate alarms instead (e.g. one for low revenue, one for high timeout %).
> {% endstep %}
{% step %}
### Save and set visibility
Choose **Private** (only you) or shared (visible to your organisation), then click **Save**.
Once saved, your alarm appears in the list. Here's what the columns mean:
| Column | Description |
| ------------------- | ------------------------------------------------------------------------------------------------------------------- |
| Name | The name of the alarm you created. |
| Active | Alarm runs automatically on schedule. Inactive alarms can still be run manually. |
| Owner | Global or only visible to the current user you when private enabled. |
| Sharing | If set to private, you can still share alarm with another user, that will become available in their own alarm panel |
| Re-trigger | Was alarm re-triggered or not |
| Acknowledged/Errors | How many checks are currently acknowledged vs. total errors generated. |
| Check run | Updates when the alarm is run manually — shows OK or error status. |
| Actions | Check now, edit, deactivate, enable re-trigger and delete |
***
## Understanding the Checks Panel
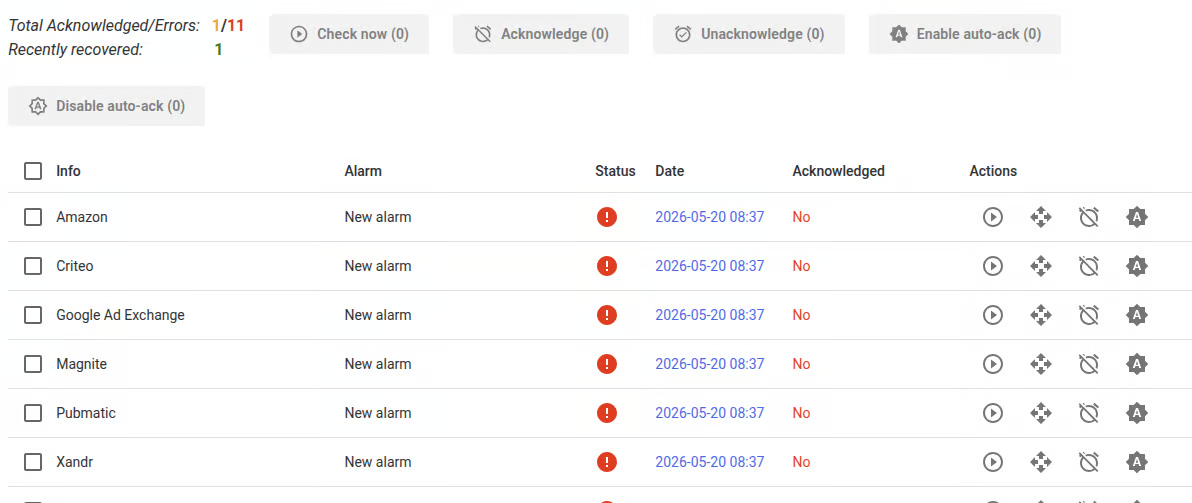
Each alarm can generate multiple **checks** — one per failing dimension combination. For example, an alarm on revenue per bidder might create separate checks for each bidder that fails the condition.
|
Column
| Descritpion |
| ----------------- | -------------------------------------------------------------------------------------------------------- |
| Info | The failing object, e.g. *site.com >> Rubicon* — the publisher/SSP combination that triggered the alarm. |
| Alarm | Name of the alarm that generated this check. |
| Status | 🔴 Failed (unacknowledged) / 🟠 Failed (acknowledged) / 🟢 Recovered |
| Date | Date of last check. Click to see the full history of status changes. |
| Acknowledged | Yes or no |
| Actions | Acknowledge, bulk-manage, or click **View report** to see the report as it was when the check ran. |
***
## Email Notifications
Go to **Generic settings** to configure who gets notified:
* **Edit global alarm recipients** — email addresses for all shared (non-private) alarms.
* **Edit my alarm recipients** — email addresses for your private alarms
### Slack notifications
Email notifications remain available for alarm recipients. When the [Using the Relevant Yield Slack Integration](/general-platform/using-the-relevant-yield-slack-integration.md) is enabled, alarms can also send notifications to Slack. When editing alarm recipients, connect your Slack workspace and select Slack recipients. See [Using the Relevant Yield Slack Integration](/general-platform/using-the-relevant-yield-slack-integration.md) for setup details.
***
## Filtering Checks by Status
Use the **Show checks** dropdown to filter the checks panel:
* **Unacknowledged** — active errors not yet reviewed
* **Acknowledged** — errors you've marked as seen
* **Recently recovered** — checks that recovered in the last 7 days
---
# Agent Instructions
This documentation is published with GitBook. GitBook is the documentation platform designed so that both humans and AI agents can read, navigate, and reason over technical content effectively. Learn more at gitbook.com.
## Querying This Documentation
If you need additional information that is not directly available in this page, you can query the documentation dynamically by asking a question.
Perform an HTTP GET request on the current page URL with the `ask` query parameter, and the optional `goal` query parameter:
```
GET https://docs.relevant-digital.com/hb-analytics/alarms-and-notifications/setting-up-your-hb-analytic-alarms.md?ask=&goal=
```
`ask` is the immediate question: it should be specific, self-contained, and written in natural language.
`goal` is optional and describes the broader end goal you are ultimately trying to accomplish on behalf of the user. GitBook uses it to tailor the answer towards what is most useful for that goal.
The response will contain a direct answer to the question and relevant excerpts and sources from the documentation.
Use this mechanism when the answer is not explicitly present in the current page, you need clarification or additional context, or you want to retrieve related documentation sections.